Fair Value Gap FinderFunctionality
Detection of Fair Value Gaps:
A bullish Fair Value Gap (FVG Up) is identified when the low of two candles before the current bar (low ) is greater than the high of the current bar (high ).
A bearish Fair Value Gap (FVG Down) is identified when the high of two candles before the current bar (high ) is lower than the low of the current bar (low ).
Color Coding:
Bullish Fair Value Gaps are highlighted in green to indicate potential areas of support.
Bearish Fair Value Gaps are highlighted in red to indicate potential areas of resistance.
Visualization Using Rectangles:
If an FVG is detected, the script creates a rectangle spanning a fixed number of bars (right=bar_index+5) to visualize the price inefficiency.
The rectangle extends from the upper to the lower boundary of the gap and has a semi-transparent fill (bgcolor=color.new(color, 90)) for better readability.
Implementation Details
Variable Initialization: The script defines floating-point variables (fvgUpTop, fvgUpBottom, fvgDownTop, fvgDownBottom) to store the price levels of identified gaps.
Conditional Assignments: When an FVG is detected, the corresponding top and bottom boundaries are assigned to the respective variables.
Box Creation: The box.new function is used to draw a rectangle on the chart, marking the FVG zones for better visualization.
Cari dalam skrip untuk "fair value gap"

Fair Value Gaps
Introducing the Fair Value Gaps (FVG) Indicator by OmegaTools, a distinctive and analytical tool designed for TradingView. This script meticulously identifies and visualizes fair value gaps within the market, offering traders a nuanced understanding of potential price movement areas that are not immediately apparent through traditional analysis.
Concept and Methodology:
Fair Value Gaps are identified as areas on a chart where the price has skipped over, leaving a 'gap' that has not been filled. These gaps often occur due to sudden market movements triggered by news events, changes in market sentiment, or large orders that move the price significantly. The FVG Indicator detects these gaps by analyzing price action and identifying discrepancies between high and low prices over a specified period. This approach is rooted in the belief that markets tend to return to these unfilled spaces, providing potential opportunities for traders.
How It Works:
The indicator scans the chart for gaps between the high of one session and the low of the next (or vice versa), marking these gaps visually for easy identification.
Users can customize the lookback period to adjust the sensitivity of the indicator to recent versus historical data.
The FVG Indicator employs color-coding to distinguish between bullish and bearish gaps, allowing traders to quickly gauge market sentiment around these gaps.
Using the FVG Indicator:
Apply the indicator to any chart on TradingView and adjust the input settings, including the extension of FVGs and aesthetic preferences like color, to suit your analysis style.
Use the visual cues provided by the FVG Indicator to identify potential areas where the market may move to fill the gaps.
Combine the insights from the FVG Indicator with other technical analysis tools or fundamental analysis to validate potential trading opportunities.
Originality and Usefulness:
The FVG Indicator stands out due to its focused approach to identifying and visualizing fair value gaps, a concept that is often overlooked in conventional market analysis. By providing a clear visual representation of these gaps, the indicator adds depth to market analysis, aiding in the identification of potential price reversal zones or continuation signals.
Disclaimer and Responsible Use:
The financial markets are complex and unpredictable. The FVG Indicator is designed to offer analytical insights and should be used as part of a comprehensive trading strategy. It does not guarantee profits or predict market movements with absolute certainty. Traders are encouraged to use this tool judiciously, alongside proper risk management practices. Remember, past performance does not guarantee future results, and trading involves risks, including the potential loss of investment.

Fair Value Gap Finder with Integrated Gann BoxTitle: Fair Value Gap Finder with Integrated Gann Box Analysis
Description:
The "Fair Value Gap Finder with Integrated Gann Box Analysis" is a unique technical indicator designed for traders who wish to incorporate the concepts of Fair Value Gaps (FVG) and Gann Box methodologies into their trading strategy. This tool is beneficial for both trend-following and scalping techniques across various markets and timeframes.
Functionality:
The indicator identifies Fair Value Gaps, which are areas on the chart where price has skipped a range, creating a 'gap'. Recognizing these zones can be crucial for understanding potential price support and resistance areas. Alongside FVG detection, this script employs Gann Box principles to project potential levels of interest. Gann Boxes are drawn automatically when an FVG is identified, providing additional insights based on W.D. Gann's theories, which relate to time and price symmetry.
Usage:
Upon detecting an FVG, the indicator will highlight the gap on the chart and overlay a Gann Box between the high and low points of the gap. Traders can use these zones to make informed decisions about entry and exit points, stop loss, and take profit levels. The script offers customization options for the appearance and behavior of the FVG boxes and Gann Lines, allowing users to adapt the tool to their preferences.
Originality:
What sets this indicator apart is the integration of FVG with Gann Box levels within a single tool, streamlining the analysis process. It takes the classic approach of identifying gaps and enriches it with the geometric significance of Gann's work, all while allowing users to visualize and interact with these levels in a user-friendly manner.
Open-Source Nature:
This script is open-source, making it a transparent solution for those who wish to understand the underlying calculations. While not all traders are versed in Pine Script, the logic of identifying FVGs and applying Gann Box levels is explained through the script's annotations and the user interface itself.
Instructions for Use:
Apply the script to your chart, and it will automatically detect FVGs.
Adjust the settings in the indicator's input menu to match your trading style and preferences.
Use the FVG and Gann Box levels as potential areas of interest for trade setups.
This script does not guarantee profits and should be used as part of a comprehensive trading plan. It is best used in conjunction with other analysis methods to confirm signals and strategies.

Fair Value Gaps Setup 01 [TradingFinder] FVG Absorption + CHoCH🔵 Introduction
🟣 Market Structures
Market structures exhibit a fractal and nested nature, which leads us to classify them into internal (minor) and external (major) categories. Definitions of market structure vary, with different methodologies such as Smart Money and ICT offering distinct interpretations.
To identify market structure, the initial step involves examining key highs and lows. An uptrend is characterized by successive highs and lows that are higher than their predecessors. Conversely, a downtrend is marked by successive lows and highs that are lower than their previous counterparts.
🟣 Market Trends and Movements
Market trends consist of two primary types of movements :
Impulsive Movements : These movements align with the main trend and are characterized by high strength and momentum.
Corrective Movements : These movements counter the main trend and are marked by lower strength and momentum.
🟣 Break of Structure (BOS)
In a downtrend, a Break of Structure (BOS) occurs when the price falls below the previous low and establishes a new low (LL). In an uptrend, a BOS, also known as a Market Structure Break (MSB), happens when the price rises above the last high.
To confirm a trend, at least one BOS is necessary, which requires the price to close at least one candle beyond the previous high or low.
🟣 Change of Character (CHOCH)
Change of Character (CHOCH) is a crucial concept in market structure analysis, indicating a shift in trend. A trend concludes with a CHOCH, also referred to as a Market Structure Shift (MSS).
For example, in a downtrend, the price continues to drop with BOS, showcasing the trend's strength. However, when the price rises and exceeds the last high, a CHOCH occurs, signaling a potential transition from a downtrend to an uptrend.
It is essential to note that a CHOCH does not immediately indicate a buy trade. Instead, it is prudent to wait for a BOS in the upward direction to confirm the uptrend. Unlike BOS, a CHOCH confirmation does not require a candle to close; merely breaking the previous high or low with the candle's wick is sufficient.
🟣 Spike | Inefficiency | Imbalance
All these terms mean fast price movement in the shortest possible time.
🟣 Fair Value Gap (FVG)
To pinpoint the "Fair Value Gap" (FVG) on a chart, a detailed candle-by-candle analysis is necessary. This process involves focusing on candles with substantial bodies and evaluating them in relation to the candles immediately before and after them.
Here are the steps :
Identify the Central Candle : Look for a candle with a large body.
Examine Adjacent Candles : The candles before and after this central candle should have long shadows, and their bodies must not overlap with the body of the central candle.
Determine the FVG Range : The distance between the shadows of the first and third candles defines the FVG range.
This method helps in accurately identifying the Fair Value Gap, which is crucial for understanding market inefficiencies and potential price movements.
🟣 Setup
This setup is based on Market Structure and FVG. After a change of character and the formation of FVG in the last lag of the price movement, we are looking for trading positions in the price pullback.
Bullish Setup :
Bearish Setup :
🔵 How to Use
After forming the setup, you can enter the trade using a pending order or after receiving confirmation. To increase the probability of success, you can adjust the pivot period market structure settings or modify the market movement coefficient in the formation leg of the FVG.
Bullish Setup :
Bearish Setup :
🔵 Setting
Pivot Period of Market Structure Detector :
This parameter allows you to configure the zigzag period based on pivots. Adjusting this helps in accurately detecting order blocks.
Show major Bullish ChoCh Lines :
You can toggle the visibility of the Demand Main Zone and "ChoCh" Origin, and customize their color as needed.
Show major Bearish ChoCh Lines :
Similar to the Demand Main Zone, you can control the visibility and color of the Supply Main Zone and "ChoCh" Origin.
FVG Detector Multiplier Factor :
This feature lets you adjust the size of the moves forming the Fair Value Gaps (FVGs) using the Average True Range (ATR). The default value is 1, suitable for identifying most setups. Adjust this value based on the specific symbol and market for optimal results.
FVG Validity Period :
This parameter defines the validity period of an FVG in terms of the number of candles. By default, an FVG remains valid for up to 15 candles, but you can adjust this period as needed.
Mitigation Level FVG :
This setting establishes the basic level of an FVG. When the price reaches this level, the FVG is considered mitigated.
Level in Low-Risk Zone :
This feature aims to reduce risk by dividing the FVG into two equal areas: "Premium" (upper area) and "Discount" (lower area). For lower risk, ensure that "Demand FVG" is in the "Discount" area and "Supply FVG" in the "Premium" area. This feature is off by default.
Show or Hide :
Given the potential abundance of setups, displaying all on the chart can be overwhelming. By default, only the last setup is shown, but you can enable the option to view all setups.
Alert Settings :
On / Off : Toggle alerts on or off.
Message Frequency : Determine how often alerts are triggered.
Options include :
"All" (alerts every time the function is called)
"Once Per Bar" (alerts only on the first call within the bar)
"Once Per Bar Close" (alerts only at the last script execution of the real-time bar upon closing)
The default setting is "Once Per Bar".
Show Alert Time by Time Zone : Set the alert time based on your preferred time zone, such as "UTC-4" for New York time. The default is "UTC".
Display More Info : Optionally show additional details like the price range of the order blocks and the date, hour, and minute in the alert message. Set this to "Off" if you prefer not to receive this information.

Fair Value Gaps Mitigation Oscillator [LuxAlgo]The Fair Value Gaps Mitigation Oscillator is an oscillator based on the traditional Fair Value Gaps (FVGs) imbalances. The oscillator displays the current total un-mitigated values for the number of FVGs chosen by the user.
The indicator also displays each New FVG as a bar representing the current ratio of the New FVG in relation to the current un-mitigated total for its direction.
🔶 USAGE
When an FVG forms, it is often interpreted as strong market sentiment in the direction of the gap. For example, an upward FVG during an uptrend is typically seen as a confirmation of the strength and continuation of the trend, as it indicates that buyers are willing to purchase at higher prices without much resistance, suggesting strong demand and positive sentiment.
By analyzing the mitigation (or lack thereof), we can visualize the increase of directional strength in a trend. This is where the proposed oscillator is useful.
🔶 DETAILS
The oscillator's values are expressed as Percentages (%). Each FVG is allocated 100% of the total of its width with a max potential value of 100 and minimum potential value of 0.
Based on the "FVG Lookback" Input, the FVGs are scaled to fit within the range of +1 to -1. Using a higher "FVG Lookback" value will allow you to get indications of longer-term trends.
A higher value of the normalized bullish FVG areas suggest a stronger and cleaner uptrend, while lower values of the bearish the normalized bullish FVG areas suggest a stronger and cleaner downtrend.
+1 or -1 indicates that there is a Full Lookback of FVGs, and each one is fully un-mitigated, and the opposite direction of FVGs is entirely Mitigated.
When the price closes over/under or within an FVG it begins to get mitigated, when this happens the % of mitigation is subtracted from the total.
When a New FVG is formed, a Histogram bar is created representing the ratio of the current FVG's width to the total width off all un-mitigated FVGs.
The entire bar represents 100% of total un-mitigated FVG Width.
The filled area represents the current FVG's width relative to the whole.
A 50% hash mark is also displayed for reference.
🔶 SETTINGS
FVG Lookback - Determines the number of FVGs (Bullish and Bearish Pairs) to keep in memory for analysis.

Fair Value Gap [Custom]📌 FVG Indicator – Smart Money Concepts Tool
This script is based on Smart Money Concepts (SMC) and automatically detects and marks Fair Value Gaps (FVG) on the chart, helping traders identify unbalanced price areas left behind by institutional moves.
🧠 What is an FVG?
An FVG (Fair Value Gap) is the price gap formed when the market moves rapidly, leaving behind a candle range where no trading occurred — typically between Candle 1’s high and Candle 3’s low (in a three-candle pattern). These gaps often signal imbalance, created during structural breaks or liquidity grabs, and may act as retrace zones or entry points.
🛠 Features:
✅ Automatically detects and highlights FVG zones (high-low range)
✅ Differentiates between open (unfilled) and closed (filled) FVGs
✅ Adjustable timeframe settings (works best on 1H–4H charts)
✅ Option to toggle display of filled FVGs
✅ Great for identifying pullback entries, continuation zones, or reversal setups
💡 Recommended Use:
After BOS/CHoCH, watch for price to return to the FVG for entry
Combine with Order Blocks and liquidity zones for higher accuracy
Best used as part of an ICT or SMC-based trading system

Fair Value Gaps by DGTFair Value Gaps
A refined, multi-timeframe Fair Value Gap (FVG) detection tool that brings institutional imbalance zones to life directly on your chart.
Designed for precision, it visualizes how price delivers into inefficiencies across chart, higher, and lower (intrabar) timeframes — offering a fluid, structural view of liquidity displacement and market flow.
The script continuously tracks unfilled, partially repaired, and fully resolved imbalances, revealing where liquidity inefficiencies concentrate and where price may seek rebalancing.
Overlapping zones naturally expose institutional footprints, potential liquidity targets, and key re-pricing regions within the broader market structure.
KEY FEATURES
⯌ Multi-Timeframe Detection
Detect and display FVGs from the current chart, higher timeframes (HTF), or lower timeframes (LTF)
⯌ Smart Fill Tracking
Automatic real-time monitoring of each FVG’s fill progress with live percentage updates
⯌ Custom Fill Logic
Choose your preferred definition of when a gap is considered filled: Any Touch
Midpoint Reached
Wick Sweep
Body Beyond
⯌ Dynamic Labels & Tooltips
Labels can be toggled on/off. Even when hidden, detailed tooltips remain available by hovering over the FVG midpoint.
⯌ Adaptive Lower-Timeframe Mode
When set to “Auto,” the script intelligently selects the optimal lower timeframe based on the chart resolution.
DISCLAIMER
This script is intended for informational and educational purposes only. It does not constitute financial, investment, or trading advice. All trading decisions made based on its output are solely the responsibility of the user.

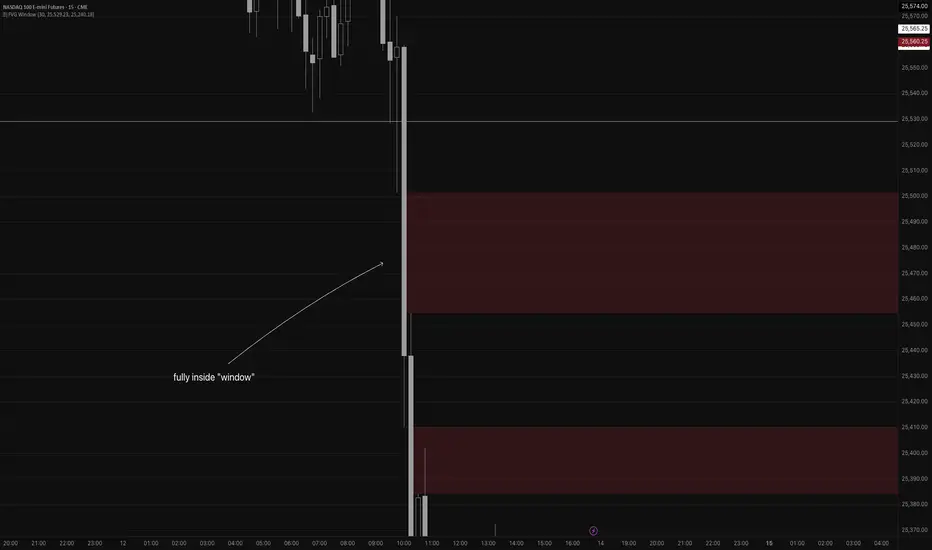
Fair Value Gap WindowStupid little toy I made to get my toes back in the water. How does this work?
Detects fair value gaps up to the count you specify in the settings
Plots them on the chart if they are inside of the 2 lines (top and bottom)
If the fair value gap is partially outside of the "window", it will only draw the part of it thats inside the window.
Not really useful but if you wanna take a look at the code for practice for yourself, feel free I guess haha
Fair Value Gaps (FVG)This indicator automatically detects Fair Value Gaps (FVGs) using the classic 3-candle structure (ICT-style).
It is designed for traders who want clean charts and relevant FVGs only, without the usual clutter from past sessions or tiny, meaningless gaps.
Key Features
• Bullish & Bearish FVG detection
Identifies imbalances where price fails to trade efficiently between candles.
• Automatic FVG removal when filled
As soon as price trades back into the gap, the box is deleted in real time – no more outdated zones on the chart.
• Only shows FVGs from the current session
At the start of each new session, all previous FVGs are cleared.
Perfect for intraday traders who only care about today’s liquidity map.
• Flexible minimum gap size filter
Avoid noise by filtering FVGs using one of three modes:
Ticks (based on market tick size)
Percent (relative to current price)
Points (absolute price distance)
• Right-extension option
Keep gaps extended forward in time or limit them to the candles that created them.
Why This Indicator?
Many FVG indicators overwhelm the chart with zones from previous days or tiny imbalances that don’t matter.
This version keeps things clean, meaningful, and real-time accurate, ideal for day traders who rely on market structure and liquidity.

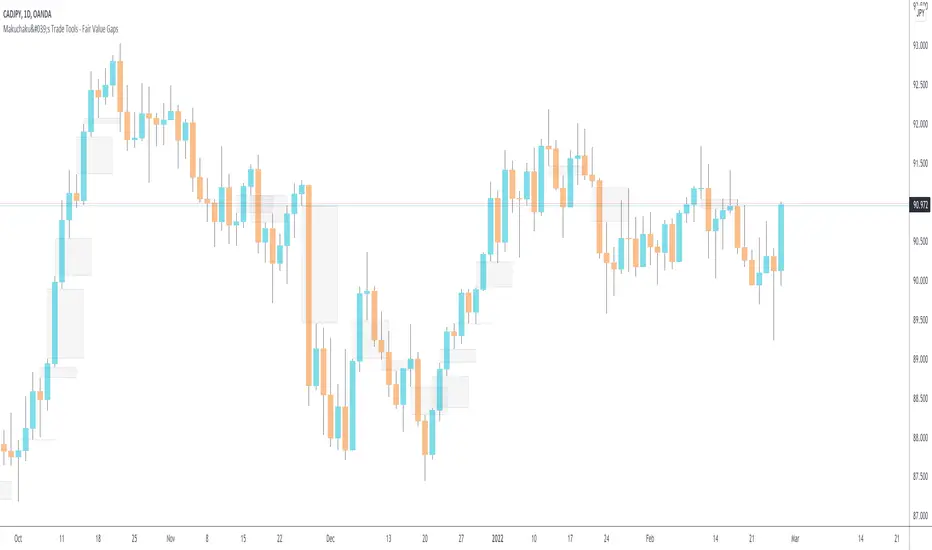
Makuchaku's Trade Tools - Fair Value GapsFair Value Gaps are a 3 candlesticks patterns, formed when the 3rd candle does not fully overlaps the 1st candle, leaving a gap in the 2nd candle.
Fair Value Gap / FVG - HTF Orderflow bias / trendCalculates Fair Value Gap (FVG) as a counter and plots it below price.
FVG Counter value resets to +ve or -ve once the FVG counter reverses direction.
Use this script to find a bias to trade with.
Best used on HTF (like 1W, 1D), so the bias can be transferred to LTF (like 4H, 1H).
If you end up using this script, please leave a comment below on how you used it. I can try to incorporate those ideas in an update.
Cheers!

Fair Value Gaps [MattyBTradez]This indicator marks out every Fair Value Gap, and the colors are customizable.

Fair Value Gap ZonesDescription
This script automatically detects and highlights Fair Value Gaps (FVGs) on any chart and timeframe.
It identifies bullish and bearish imbalance zones using candle-to-candle price displacement and shades them visually on the chart for easy reference.
Bullish FVGs are marked with dark green zones, showing areas where price may later return before continuing upward.
Bearish FVGs are shaded in light red, indicating potential retracement zones in downtrends.
All zones extend forward automatically, updating dynamically as new candles form.
Designed for traders who use Smart Money Concepts (SMC) or ICT-style analysis, this tool helps visualize market inefficiencies and potential reaction points with clear, minimal visuals.
Fair Value Gaps (Volumetric) | Flux Charts💎 GENERAL OVERVIEW
Introducing a brand new Fair Value Gaps (FVG) indicator, now with Volumetric Zones! You can now see the total volume of FVG zones, as well as their bullish & bearish volume ratio.
Features of the Volumetric FVG Indicator :
Render Bullish / Bearish FVG Zones
See Total Volume Of The FVG Zones
See The Ratio Of Bullish / Bearish Bar Volume Of FVG Zones
Combination Of Overlapping FVG Zones
Variety Of Zone Detection/ Sensitivity / Filtering / Invalidation Settings
High Customizability
🚩UNIQUENESS
The ability to render the total volume of FVGs as well as bullish / bearish volume ratio is what sets this FVG indicator apart from others. Also the ability to combine overlapping FVG zones will result in cleaner charts for traders.
⚙️SETTINGS
1. General Configuration
Zone Invalidation -> Select between Wick & Close price for FVG Zone Invalidation.
Zone Filtering -> With "Average Range" selected, algorithm will find FVG zones in comparison with average range of last bars in the chart. With the "Volume Threshold" option, you may select a Volume Threshold % to spot FVGs with a larger total volume than average.
FVG Detection -> With the "Same Type" option, all 3 bars that formed the FVG should be the same type. (Bullish / Bearish). If the "All" option is selected, bar types may vary between Bullish / Bearish.
Detection Sensitivity -> You may select between Low, Normal or High FVG detection sensitivity. This will essentially determine the size of the spotted FVGs, with lower sensitivities resulting in spotting bigger FVGs, and higher sensitivities resulting in spotting all sizes of FVGs.
Show Historic Zones -> If this option is on, the indicator will render invalidated FVG zones as well as current FVG zones. For a cleaner look at current FVG zones which are not invalidated yet, you can turn this option off.

stelaraX - Fair Value GapstelaraX – Fair Value Gap
stelaraX – Fair Value Gap is a technical analysis indicator designed to detect, visualize, and manage Fair Value Gaps (FVGs) using a strict three-candle imbalance model. The script identifies bullish and bearish gaps, draws them as zones on the chart, and tracks their mitigation status over time.
For advanced AI-based chart analysis and automated structure interpretation, visit stelarax.com
Core logic
The indicator detects Fair Value Gaps using a three-bar condition:
* bullish FVG when the current low is above the high from two bars ago
* bearish FVG when the current high is below the low from two bars ago
Detected gaps are filtered using minimum size requirements:
* minimum size in ticks
* minimum size as a percentage of price
Each FVG stores its top and bottom boundaries, its midpoint level (Consequent Encroachment), the creation bar, and its current state.
Consequent Encroachment and mitigation
The script can optionally plot the Consequent Encroachment (CE) level, defined as the midpoint of the gap.
Mitigation tracking is supported and can be defined as:
* Touch
* 50 percent retracement to the CE level
* Full fill of the gap
When mitigation occurs, the FVG can:
* remain visible in a mitigated state
* be deleted automatically
* stop extending and close at the mitigation bar
Mitigation styling uses a dedicated color scheme to clearly separate active and mitigated gaps.
Visualization
FVGs are drawn directly on the chart as colored zones:
* bullish FVGs are displayed in green tones
* bearish FVGs are displayed in red tones
Optional features include:
* CE level line with configurable line style
* FVG labels
* automatic extension of active gaps
* configurable maximum age and maximum number of displayed gaps
All colors and display settings are fully customizable.
Dashboard
An optional on-chart dashboard provides a real-time overview of:
* total bullish and bearish FVGs
* mitigated bullish and bearish FVGs
* active (unmitigated) FVGs
* mitigation percentages
Dashboard position and text size are configurable.
Alerts
Alert conditions are available for:
* newly detected bullish FVGs
* newly detected bearish FVGs
Additional real-time alerts can be triggered when an FVG is mitigated.
Use case
This indicator is intended for:
* imbalance and fair value gap mapping
* identifying potential reaction zones and retracement areas
* tracking gap mitigation behavior over time
* multi-timeframe confluence analysis
For a fully automated AI-driven chart analysis solution, additional tools and insights are available at stelarax.com
Disclaimer
This indicator is provided for educational and technical analysis purposes only and does not constitute financial advice or trading recommendations. All trading decisions and risk management remain the responsibility of the user.

FVG & IFVG ICT [TradingFinder] Inversion Fair Value Gap Signal🔵 Introduction
🟣 Fair Value Gap (FVG)
To spot a Fair Value Gap (FVG) on a chart, you need to perform a detailed candle-by-candle analysis.
Here’s the process :
Focus on Candles with Large Bodies : Identify a candle with a substantial body and examine it alongside the preceding candle.
Check Surrounding Candles : The candles immediately before and after the central candle should have long shadows.
Ensure No Overlap : The bodies of the candles before and after the central candle should not overlap with the body of the central candle.
Determine the FVG Range : The gap between the shadows of the first and third candles forms the FVG range.
🟣 ICT Inversion Fair Value Gap (IFVG)
An ICT Inversion Fair Value Gap, also known as a reverse FVG, is a failed fair value gap where the price does not respect the gap. An IFVG forms when a fair value gap fails to hold the price and the price moves beyond it, breaking the fair value gap.
This marks the initial shift in price momentum. Typically, when the price moves in one direction, it respects the fair value gaps and continues its trend.
However, if a fair value gap is violated, it acts as an inversion fair value gap, indicating the first change in price momentum, potentially leading to a short-term reversal or a subsequent change in direction.
🟣 Bullish Inversion Fair Value Gap (Bullish IFVG)
🟣 Bearish Inversion Fair Value Gap (Bearish IFVG)
🔵 How to Use
🟣 Identify an Inversion Fair Value Gap
To identify an IFVG, you first need to recognize a fair value gap. Just as fair value gaps come in two types, inversion fair value gaps also fall into two categories:
🟣 Bullish Inversion Fair Value Gap
A bullish IFVG is essentially a bearish fair value gap that is invalidated by the price closing above it.
Here’s how to identify it :
Identify a bearish fair value gap.
When the price closes above this bearish fair value gap, it transforms into a bullish inversion fair value gap.
This gap acts as support for the price and drives it upwards, indicating a reduction in sellers' strength and an initial shift in momentum towards buyers.
🟣 Bearish Inversion Fair Value Gap
A bearish IFVG is primarily a bullish fair value gap that fails to hold the price, with the price closing below it.
Here’s how to identify it :
Identify a bullish fair value gap.
When the price closes below this gap, it becomes a bearish inversion fair value gap.
This gap acts as resistance for the price, pushing it downwards. A bearish inversion fair value gap signifies a decrease in buyers' momentum and an increase in sellers' strength.
🔵 Setting
🟣 Global Setting
Show All FVG : If it is turned off, only the last FVG will be displayed.
S how All Inversion FVG : If it is turned off, only the last FVG will be displayed.
FVG and IFVG Validity Period (Bar) : You can specify the maximum time the FVG and the IFVG remains valid based on the number of candles from the origin.
Switching Colors Theme Mode : Three modes "Off", "Light" and "Dark" are included in this parameter. "Light" mode is for color adjustment for use in "Light Mode".
"Dark" mode is for color adjustment for use in "Dark Mode" and "Off" mode turns off the color adjustment function and the input color to the function is the same as the output color.
🟣 Logic Setting
FVG Filter
When utilizing FVG filtering, the number of identified FVG areas undergoes refinement based on a specified algorithm. This process helps to focus on higher quality signals and eliminate noise.
Here are the types of FVG filters available :
Very Aggressive Filter : Introduces an additional condition to the initial criteria. For an upward FVG, the highest price of the last candle must exceed the highest price of the middle candle. Similarly, for a downward FVG, the lowest price of the last candle should be lower than the lowest price of the middle candle. This mode minimally filters out FVGs.
Aggressive Filter : Builds upon the Very Aggressive mode by considering the size of the middle candle. It ensures the middle candle is not too small, thereby eliminating more FVGs compared to the Very Aggressive mode.
Defensive Filter : In addition to the conditions of the Very Aggressive mode, the Defensive mode incorporates criteria regarding the size and structure of the middle candle. It requires the middle candle to have a substantial body, with specific polarity conditions for the second and third candles relative to the first candle's direction. This mode filters out a significant number of FVGs, focusing on higher-quality signals.
Very Defensive Filter : Further refines filtering by adding conditions that the first and third candles should not be small-bodied doji candles. This stringent mode eliminates the majority of FVGs, retaining only the highest quality signals.
Mitigation Level FVG and IFVG : Its inputs are one of "Proximal", "Distal" or "50 % OB" modes, which you can enter according to your needs. The "50 % OB" line is the middle line between distal and proximal.
🟣 Display Setting
Show Bullish FVG : Enables the display of demand-related boxes, which can be toggled on or off.
Show Bearish FVG : Enables the display of supply-related boxes along the path, which can also be toggled on or off.
Show Bullish IFVG : Enables the display of demand-related boxes, which can be toggled on or off.
Show Bearish IFVG : Enables the display of supply-related boxes along the path, which can also be toggled on or off.
🟣 Alert Setting
Alert FVG Mitigation : If you want to receive the alert about FVG's mitigation after setting the alerts, leave this tick on. Otherwise, turn it off.
Alert Inversion FVG Mitigation : If you want to receive the alert about Inversion FVG's mitigation after setting the alerts, leave this tick on. Otherwise, turn it off.
Message Frequency : This parameter, represented as a string, determines the frequency of announcements. Options include: 'All' (triggers the alert every time the function is called), 'Once Per Bar' (triggers the alert only on the first call within the bar), and 'Once Per Bar Close' (activates the alert only during the final script execution of the real-time bar upon closure). The default setting is 'Once per Bar'.
Show Alert time by Time Zone : The date, hour, and minute displayed in alert messages can be configured to reflect any chosen time zone. For instance, if you prefer London time, you should input 'UTC+1'. By default, this input is configured to the 'UTC' time zone.
Display More Info : The 'Display More Info' option provides details regarding the price range of the order blocks (Zone Price), along with the date, hour, and minute. If you prefer not to include this information in the alert message, you should set it to 'Off'.

Inversion Fair Value Gaps [TradingFinder] IFVG ICT Signal| Alert🔵 Introduction
🟣 Inversion Fair Value Gap (IFVG)
An ICT Inversion Fair Value Gap, or reverse FVG, occurs when a fair value gap fails to hold its price, resulting in the price moving beyond and breaking the gap. This situation marks the initial change in price momentum.
Generally, prices respect fair value gaps and continue in their trend direction. However, when a fair value gap is breached, it transforms into an inversion fair value gap, signaling a potential short-term reversal or a subsequent change in direction.
🔵 How to Use
🟣 Identifying an Inversion Fair Value Gap
To spot an IFVG, you must first identify a fair value gap.
Inversion fair value gaps can be categorized into two types :
🟣 Bullish Inversion Fair Value Gap
A bullish IFVG occurs when a bearish fair value gap is invalidated by the price closing above it.
Steps to identify it :
Identify a bearish fair value gap.
When the price closes above this gap, it becomes a bullish inversion fair value gap.
This gap acts as a support level, pushing the price upwards and indicating a shift in momentum from sellers to buyers.
🟣 Bearish Inversion Fair Value Gap
A bearish IFVG happens when a bullish fair value gap fails, with the price closing below it.
Steps to identify it :
Identify a bullish fair value gap.
When the price closes below this gap, it becomes a bearish inversion fair value gap.
This gap acts as a resistance level, pushing the price downwards and indicating a shift in momentum from buyers to sellers.
🔵 Settings
🟣 Global Settings
Show All Inversion FVG: If disabled, only the most recent FVG will be displayed.
IFVG Validity Period (Bar): Determines the maximum duration (in number of candles) that the FVG and IFVG remain valid.Switching Colors Theme Mode: Includes three modes: "Off", "Light", and "Dark". "Light" mode adjusts colors for light mode use, "Dark" mode adjusts colors for dark mode use, and "Off" disables color adjustments.
🟣 Logic Settings
FVG Filter : This refines the number of identified FVG areas based on a specified algorithm to focus on higher quality signals and reduce noise.
Types of FVG filters :
Very Aggressive Filter : Adds a condition where, for an upward FVG, the last candle's highest price must exceed the middle candle's highest price, and for a downward FVG, the last candle's lowest price must be lower than the middle candle's lowest price. This minimally filters out FVGs.
Aggressive Filte r: Builds on the Very Aggressive mode by ensuring the middle candle is not too small, filtering out more FVGs.
Defensive Filter : Adds criteria regarding the size and structure of the middle candle, requiring it to have a substantial body and specific polarity conditions, filtering out a significant number of FVGs.
Very Defensive Filter : Further refines filtering by ensuring the first and third candles are not small-bodied doji candles, retaining only the highest quality signals.
Mitigation Level FVG and IFVG : Options include "Proximal", "Distal", or "50 % OB" modes, which you can choose based on your needs. The "50 % OB" line is the midpoint between distal and proximal.
🟣 Display Settings
Show Bullish IFVG : Toggles the display of demand-related boxes.
Show Bearish IFVG : Toggles the display of supply-related boxes.
🟣 Alert Settings
Alert Inversion FVG Mitigation : Enables alerts for Inversion FVG mitigation.
Message Frequency : Determines the frequency of alerts. Options include 'All' (every function call), 'Once Per Bar' (first call within the bar), and 'Once Per Bar Close' (final script execution of the real-time bar). Default is 'Once per Bar'.
Show Alert Time by Time Zone : Configures the time zone for alert messages. Default is 'UTC'.
Display More Info : Provides additional details in alert messages, including price range, date, hour, and minute. Set to 'Off' to exclude this information.

Volumetric Inverse Fair Value Gap (IFVG) [Kodexius]The Volumetric Inverse Fair Value Gap (IFVG) indicator detects and visualizes inverse fair value gaps (IFVGs) zones where previous inefficiencies in price (fair value gaps) are later invalidated or “inverted.”
Unlike traditional FVG indicators, this tool integrates volume-based analysis to quantify the bullish, bearish, and overall strength of each inversion. It visually represents these metrics within a dynamically updating box on the chart, giving traders deeper insight into market reactions when liquidity imbalances are filled and reversed.
Features
Inverse fair value gap detection
The script identifies bullish and bearish fair value gaps, stores them as pending zones, and turns them into inverse fair value gaps when price trades back through the gap in the opposite direction. Each valid inversion becomes an active IFVG zone on the chart.
Sensitivity control with ATR filter and strict mode
A minimum gap size based on ATR is used to filter out small and noisy gaps. Strict mode can be enabled so that any wick contact between the relevant candles prevents the gap from being accepted as a fair value gap. This lets you decide how clean and selective the zones should be.
Show Last N Boxes control
The indicator can keep only the most recent N IFVG zones visible. Older zones are removed from the chart once the number of active objects exceeds the user setting. This prevents clutter on higher timeframes or long histories and keeps attention on the most relevant recent zones.
Ghost box for the original gap
When the ghost option is enabled, the script draws a faint box that marks the original fair value gap from which the inverse zone came. This makes it easy to see where the initial imbalance appeared and how price later inverted that area.
Volumetric bull, bear and strength metrics
For each IFVG, the script estimates how much of the bar volume is associated with buying and how much with selling, then computes bull percentage, bear percentage and a strength score that uses a percentile rank of volume. These values are stored with the IFVG object and drive the visualization inside the zone.
Three band visual layout inside each IFVG
Each active IFVG is drawn as a container with three horizontal sections. The top band represents the bull percentage, the middle band the bear percentage and the bottom band the strength metric. The width of each bar reflects its respective value so you can read the structure of the zone at a glance.
Customizable colors and label text
Colors for bull, bear, strength, the empty background area, the ghost box and label text can be adjusted in the inputs. This allows you to match the indicator to different chart themes or highlight specific aspects such as strength or direction.
Automatic invalidation and cleanup
When price clearly closes beyond the IFVG in a way that breaks the logic of that zone, the script marks it as inactive and deletes all boxes and labels linked to it. Only valid and active IFVGs remain on the chart, which keeps the display clean and focused.
Calculations
1. Detecting Fair Value Gaps (FVGs)
A fair value gap is identified when price action leaves an imbalance between candle wicks. Depending on the mode:
Bullish FVG: When low > high
Bearish FVG: When high < low
Optionally, the strict mode ensures wicks do not touch.
The gap’s significance is filtered using the ATR multiplier input to exclude minor noise.
Once detected, FVGs are stored as pending zones until inverted by opposite movement (price crossing through).
bool bull_cond = strict_mode ? (low > high ) : (close > high )
bool bear_cond = strict_mode ? (high < low ) : (close < low )
float gap_size = 0.0
if bull_cond and close > open
gap_size := low - high
if bear_cond and close < open
gap_size := low - high
2. Creating IFVGs (Inversions)
When price later moves through a previous FVG in the opposite direction, an Inverse FVG (IFVG) is created.
For example:
A previous bearish FVG becomes bullish IFVG if price moves upward through it.
A previous bullish FVG becomes bearish IFVG if price moves downward through it.
The IFVG is initialized with structural boundaries (top, bottom) and timestamp metadata to anchor visualization.
if not p.is_bull_gap and close > p.top
inverted := true
to_bull := true
if p.is_bull_gap and close < p.btm
inverted := true
to_bull := false
3. Volume Metrics (Bull, Bear, Strength)
Each IFVG calculates buy and sell volumes from the current bar’s price spread and total volume.
Bull % = proportion of upward (buy) volume
Bear % = proportion of downward (sell) volume
Strength % = normalized percentile rank of total volume
These are obtained through a custom function that estimates directional volume contribution:
calc_metrics(float o, float h, float l, float c, float v) =>
float rng = h - l
float buy_v = 0.0
if rng == 0
buy_v := v * 0.5
else
if c >= o
buy_v := v * ((math.abs(c - o) + (math.min(o, c) - l)) / rng)
else
buy_v := v * ((h - math.max(o, c)) / rng)
float sell_v = v - buy_v
float total = buy_v + sell_v
float p_bull = total > 0 ? buy_v / total : 0
float p_bear = total > 0 ? sell_v / total : 0
float p_str = ta.percentrank(v, 100) / 100.0

Smarter Money Concepts - FVGs [PhenLabs]📊 Smarter Money Concepts - FVGs
Version: PineScript™ v6
📌 Description
Smarter Money Concepts - FVGs is a sophisticated indicator designed to identify and track Fair Value Gaps (FVGs) in price action. These gaps represent market inefficiencies where price moves quickly, creating imbalances that often attract subsequent price action for mitigation. By highlighting these key areas, traders can identify potential zones for reversals, continuations, and price targets.
The indicator employs volume filtering ideology to highlight only the most significant FVGs, reducing noise and focusing on gaps formed during periods of higher relative volume. This combination of price structure analysis and volume confirmation provides traders with high-probability areas of interest that institutional smart money may target during future price movements.
🚀 Points of Innovation
Volume-Filtered Gap Detection : Eliminates low-significance FVGs by requiring a minimum volume threshold, focusing only on gaps formed with institutional participation
Equilibrium Line Visualization : Displays the midpoint of each gap as a potential precision target for trades
Automated Gap Mitigation Tracking : Monitors when price revisits and mitigates gaps, automatically managing visual elements
Time-Based Gap Management : Intelligently filters gaps based on a configurable timeframe, maintaining chart clarity
Dual Direction Analysis : Simultaneously tracks both bullish and bearish gaps, providing a complete market structure view
Memory-Optimized Design : Implements efficient memory management for smooth chart performance even with numerous FVGs
🔧 Core Components
Fair Value Gap Detection : Identifies price inefficiencies where the current candle’s low is higher than the previous candle’s high (bearish FVG) or where the current candle’s high is lower than the previous candle’s low (bullish FVG).
Volume Filtering Mechanism : Calculates relative volume compared to a moving average to qualify only gaps formed during significant market activity.
Mitigation Tracking : Continuously monitors price action to detect when gaps get filled, with options to either hide or maintain visual representation of mitigated gaps.
🔥 Key Features
Customizable Gap Display : Toggle visibility of bullish and bearish gaps independently to focus on your preferred market direction
Volume Threshold Control : Adjust the minimum volume ratio required for gap qualification, allowing fine-tuning between sensitivity and significance
Flexible Mitigation Methods : Choose between “Wick” or “Close” methods for determining when a gap has been mitigated, adapting to different trading styles
Visual Customization : Full control over colors, transparency, and style of gap boxes and equilibrium lines
🎨 Visualization
Gap Boxes : Rectangular highlights showing the exact price range of each Fair Value Gap. Bullish gaps indicate potential upward price targets, while bearish gaps show potential downward targets.
Equilibrium Lines : Dotted lines running through the center of each gap, representing the mathematical midpoint that often serves as a precision target for price movement.
📖 Usage Guidelines
General Settings
Days to Analyze : Default: 15, Range: 1-100. Controls how many days of historical gaps to display, balancing between comprehensive analysis and chart clarity
Visual Settings
Bull Color : Default:(#596fd33f). Color for bullish Fair Value Gaps, typically using high transparency for clear chart visibility
Bear Color : Default:(#d3454575). Color for bearish Fair Value Gaps, typically using high transparency for clear chart visibility
Equilibrium Line : Default: Enabled. Toggles visibility of the center equilibrium line for each FVG
Eq. Line Color : Default: Black with 99% transparency. Sets the color of equilibrium lines, usually kept subtle to avoid chart clutter
Eq. Line Style : Default: Dotted, Options: Dotted, Solid, Dashed. Determines the line style for equilibrium lines
Mitigation Settings
Mitigation Method : Default: Wick, Options: Wick, Close. Determines how gap mitigation is calculated - “Wick” uses high/low values while “Close” uses open/close values for more conservative mitigation criteria
Hide Mitigated : Default: Enabled. When enabled, gaps become transparent once mitigated, reducing visual clutter while maintaining historical context
Volume Filter
Volume Filter : Default: Enabled. When enabled, only shows gaps formed with significant volume relative to recent average
Min Ratio : Default: 1.5, Range: 0.1-10.0. Minimum volume ratio compared to average required to display an FVG; higher values filter out more gaps
Periods : Default: 15, Range: 5-50. Number of periods used to calculate the average volume baseline
✅ Best Use Cases
Identifying potential reversal zones where price may react after extended moves
Finding precise targets for take-profit placement in trend-following strategies
Detecting institutional interest areas for potential breakout or breakdown confirmations
Plotting significant support and resistance zones based on structural imbalances
Developing fade strategies at key market structure points
Confirming trade entries when price approaches significant unfilled gaps
⚠️ Limitations
Works best on higher timeframes where gaps reflect more significant market inefficiencies
Very choppy or ranging markets may produce small gaps with limited predictive value
Volume filtering depends on accurate volume data, which may be less reliable for some symbols
Performance may be affected when displaying a very large number of historical gaps
Some gaps may never be fully mitigated, particularly in strongly trending markets
💡 What Makes This Unique
Volume Intelligence : Unlike basic FVG indicators, this script incorporates volume analysis to identify the most significant structural imbalances, focusing on quality over quantity.
Visual Clarity Management : Automatic handling of mitigated gaps and memory management ensures your chart remains clean and informative even over extended analysis periods.
Dual-Direction Comprehensive Analysis : Simultaneously tracks both bullish and bearish gaps, providing a complete market structure picture rather than forcing a directional bias.
🔬 How It Works
1. Gap Detection Process :
The indicator examines each candle in relation to previous candles, identifying when a gap forms between the low of candle and high of candle (bearish FVG) or between the high of candle and low of candle (bullish FVG). This specific candle relationship identifies true structural imbalances.
2. Volume Qualification :
For each potential gap, the algorithm calculates the relative volume compared to the configured period average. Only gaps formed with volume exceeding the minimum ratio threshold are displayed, ensuring focus on institutionally significant imbalances.
3. Equilibrium Calculation :
For each qualified gap, the script calculates the precise mathematical midpoint, which becomes the equilibrium line - a key target that price often gravitates toward during mitigation attempts.
4. Mitigation Tracking :
The indicator continuously monitors price action against existing gaps, determining mitigation based on the selected method (wick or close). When price reaches the equilibrium point, the gap is considered mitigated and can be visually updated accordingly.
💡 Note:
Fair Value Gaps represent market inefficiencies that often, but not always, get filled. Use this indicator as part of a complete trading strategy rather than as a standalone system. The most valuable signals typically come from combining FVG analysis with other confirmatory indicators and overall market context. For optimal results, start with the default settings and gradually adjust parameters to match your specific trading timeframe and style.

Multitimeframe Fair Value Gap – FVG (Zeiierman)█ Overview
The Multitimeframe Fair Value Gap – FVG (Zeiierman) indicator provides a dynamic and customizable visualization of institutional imbalances (Fair Value Gaps) across multiple timeframes. Built for traders who seek to analyze price inefficiencies, this tool helps highlight potential entry points, unmitigated gaps, and directional bias using smart volume logic and adaptive visual elements.
A Fair Value Gap (FVG) forms when there's a three-candle sequence in which a market imbalance leaves a "gap" between the wicks of candle 1 and candle 3. These areas are often considered footprints of institutional activity, and this indicator gives you the tools to track them with surgical precision across any timeframe you choose—regardless of the one you're viewing.
This indicator also includes a trend filter powered by a low-pass Butterworth filter, enabling traders to distinguish between countertrend vs. trend-aligned FVGs for more intelligent decision-making. On top of that, it features a dynamic FVG table for live tracking and bull/bear volume power visualization inside each gap, adding powerful clarity to market intent.
█ How It Works
The indicator analyzes the open, high, low, close, and volume of candles from a user-selected timeframe. It identifies Fair Value Gaps based on wick logic and only confirms those that meet customizable strength criteria. Once detected, the indicator visualizes each FVG with dynamically extending boxes, optional buy/sell volume bars, and a real-time mitigation check.
⚪ Multitimeframe Logic
Users can analyze FVGs from a higher or lower timeframe regardless of their current chart.
This is achieved using request.security() to fetch OHLCV data from the chosen timeframe.
⚪ Wick Sensitivity & Impulse Filter
The script measures the wick size of potential FVG candles and compares them to a running average. Only FVGs with wick sizes above a certain sensitivity threshold (user-controlled) are plotted. This ensures only meaningful price dislocations (e.g., strong impulsive moves) are shown, reducing noise.
⚪ Midpoint Mitigation Logic
FVGs are marked as "mitigated" when the price revisits the gap area. Traders can choose whether full gap closure or just a midpoint touch is required. This allows faster reactivity in real-time trading environments.
⚪ Bull & Bear Power – Volume-Weighted Visualization
Every Fair Value Gap box includes sub-bars representing the estimated buy and sell effort that created the gap. These are calculated using the candle's close in relation to its high/low range and volume:
Buy Volume % ≈ effort from low to close
Sell Volume % ≈ effort from high to close
Each sub-bar inside the FVG:
Is color-coded (UpCol for bullish, DnCol for bearish)
Is drawn proportionally to the strength of buyers or sellers
Visually displays who was in control during the imbalance
⚪ FVG Table – Dynamic On-Chart Overview
The indicator includes an optional on-chart table that displays all currently active (unmitigated) FVGs in a side panel format:
Automatic updates as gaps are formed and mitigated
Color-coded rows to show bullish vs. bearish FVGs
Timestamps to know precisely when the gap formed
User-controlled position via Table Left and Table Right
This is a gap watchlist overlay, giving traders a concise view of current inefficiencies without manually scanning the chart.
⚪ FVG Trend Filter (Butterworth Smoother)
Using a two-pole Butterworth low-pass filter, the indicator computes a trendline based on average FVG values, offering a smooth but responsive directional signal.
Passband Ripple (dB): Controls sensitivity and overshoot tolerance
Cutoff Frequency (0–0.5): Sets how quickly the trendline reacts
The trendline helps categorize each FVG:
Trend up → favor bullish FVGs
Trend down → favor bearish FVGs
It adds an extra dimension to FVG entries, helping distinguish between trend-aligned and countertrend signals.
█ How to Use
⚪ Identify Institutional Gaps
Use this tool to identify areas where institutions may have left imbalances behind quickly.
These areas often become:
Strong support/resistance zones
Areas where price might react sharply
Targets for liquidity sweeps or retracements
⚪ React to Trend or Countertrend
The built-in trendline helps categorize each FVG:
Trend up → Bullish FVGs have higher validity
Trend down → Bearish FVGs have higher validity
⚪ Volume Context via Bull/Bear Power
Each Fair Value Gap is more than just a price imbalance — it’s a story of effort and intent. The Bull/Bear Power feature visualizes the buy and sell pressure behind each FVG, helping you understand how the gap was formed and who was in control.
A bullish FVG with a strong buy effort suggests continuation potential — buyers dominated the move.
A bullish FVG with a dominant sell effort could signal a trap or reversal — sellers may have overwhelmed the breakout.
These insights allow you to confirm imbalance strength, spot traps early, and add confidence to entries based on dominant volume profiles.
Instead of viewing gaps as static zones, this feature turns each into a live volume map — a visual breakdown of who moved the market and whether that move had conviction.
⚪ Plan with the FVG Table
The FVG Table acts as your on-chart control center for tracking active imbalances. When enabled, it provides a clear summary of all unmitigated Fair Value Gaps, helping you stay organized and focused during fast-moving sessions.
Track live and historical gaps: See exactly when and where each FVG formed.
Monitor older, still-valid zones: Gaps off-screen but not mitigated remain in play — perfect for anticipating future reactions.
Gauge market bias at a glance: The balance of bullish vs. bearish FVGs helps you understand overall directional pressure.
Plan entries confidently: Use the table to reference all zones for risk management, confluence stacking, or layered execution strategies.
Instead of manually scanning your chart, the FVG Table offers a clean, at-a-glance overview of the market’s inefficiencies — giving you the structure needed to act with precision.
█ Settings
FVG Timeframe
Select any timeframe to source FVGs independent of your current chart.
Sensitivity
Filter FVGs by how impulsive the move is — it helps you eliminate weak gaps.
Mitigated on Mid
Control whether gaps are removed at midpoint touch or full fill.
Table Settings
Control the table position and width. Cleanly view all active FVGs.
FVG Style
Customize gap box colors, length, and bullish/bearish overlays.
Trend Filter
Enable or disable the smoothed FVG-based trendline with customizable smoothing controls.
-----------------
Disclaimer
The content provided in my scripts, indicators, ideas, algorithms, and systems is for educational and informational purposes only. It does not constitute financial advice, investment recommendations, or a solicitation to buy or sell any financial instruments. I will not accept liability for any loss or damage, including without limitation any loss of profit, which may arise directly or indirectly from the use of or reliance on such information.
All investments involve risk, and the past performance of a security, industry, sector, market, financial product, trading strategy, backtest, or individual's trading does not guarantee future results or returns. Investors are fully responsible for any investment decisions they make. Such decisions should be based solely on an evaluation of their financial circumstances, investment objectives, risk tolerance, and liquidity needs.

Volumetric Fair Value Gaps [AlgoAlpha]🎯 Introducing the Volumetric Fair Value Gaps by AlgoAlpha 🎯
Embrace the power of volume and price action with the Volumetric Fair Value Gaps (VFVG) indicator, designed meticulously by AlgoAlpha. This innovative tool enhances your charting capabilities by highlighting fair value gaps in real-time, facilitating superior market entry and exit decisions. 🚀📈
🔍 Key Features:
🔹 Fair Value Gap Detection: Utilizes price action and volume to identify significant fair value gaps, offering potential high-probability trading opportunities.
🔹 Adjustability: Customize the sensitivity with 'FVG Noise Reduction Length' and 'Noise Reduction Factor' to match the volatility and characteristics of the asset being traded.
🔹 Visual Appeal: Displays bullish gaps in a soothing Bullish Color and bearish gaps in a striking Bearish Color, making it easy to spot and analyze trends on the fly.
🔹 Overlay Feature: Plots directly on the price chart for seamless integration and analysis.
🌟 Quick Guide to Using the Volumetric Fair Value Gaps Indicator:
🛠 Add the Indicator: Add the indicator to favourites and set it up with your desired settings.
📊 Market Analysis: Watch for the appearance of colored boxes (blue for bearish, gray for bullish) which represent the fair value gaps. These are high-probability areas for reversals or continuations. FVGs with higher volume are implied to induce a stronger reaction on price.
🔔 Alerts: Set up alerts to notify you when new gaps are detected, ensuring you never miss out on potential trades!
🛠 How It Works:
The Volumetric Fair Value Gaps (VFVG) indicator identifies significant price gaps that are not just based on price action but are also substantiated by volume, which are often overlooked in typical analyses. It operates by comparing the current candle’s price range against historical averages and is calculated over a user-defined period, displayed with volume for further insights. For a gap to be recognized as significant (either bullish or bearish), it must exceed a certain size relative to these averages, which can be adjusted for sensitivity using the provided settings. Bullish gaps are identified when the current low is higher than the second previous high after surpassing the threshold, and bearish gaps are marked when the current high is below the second previous low, similarly surpassing the threshold. This dual-confirmation (volume and price deviation) approach minimizes false signals and enhances the reliability of identified gaps.
Maximize your trading strategy with the VFVG Indicator by AlgoAlpha and turn those gaps into opportunities! 🌈✨

Inversion Fair Value Gap Screener | Flux Charts💎 GENERAL OVERVIEW
Introducing our new Inverse Fair Value Gap Screener! This screener can provide information about the latest Inverse Fair Value Gaps in up to 5 tickers. You can also customize the algorithm that finds the Inverse Fair Value Gaps and the styling of the screener.
Features of the new Inverse Fair Value Gap (IFVG) Screener :
Find Latest Inverse Fair Value Gaps Across 5 Tickers
Shows Their Information Of :
Latest Status
Number Of Retests
Consumption Percent
Volume
Customizable Algorithm / Styling
📌 HOW DOES IT WORK ?
A Fair Value Gap generally occur when there is an imbalance in the market. They can be detected by specific formations within the chart. An Inverse Fair Value Gap is when a FVG becomes invalidated, thus reversing the direction of the FVG.
IFVGs get consumed when a Close / Wick enters the IFVG zone. Check this example:
This screener then finds Fair Value Gaps across 5 different tickers, and shows the latest information about them.
Status ->
Far -> The current price is far away from the IFVG.
Approaching ⬆️/⬇️ -> The current price is approaching the IFVG, and the direction it's approaching from.
Inside -> The price is currently inside the IFVG.
Retests -> Retest means the price tried to invalidate the IFVG, but failed to do so. Here you can see how many times the price retested the IFVG.
Consumed -> IFVGs get consumed when a Close / Wick enters the IFVG zone. For example, if the price hits the middle of the IFVG zone, the zone is considered 50% consumed.
Volume -> Volume of a IFVG is essentially the volume of the bar that broke the original FVG that formed it.
🚩UNIQUENESS
This screener can detect latest Inverse Fair Value Gaps and give information about them for up to 5 tickers. This saves the user time by showing them all in a dashboard at the same time. The screener also uniquely shows information about the number of retests and the consumed percent of the IFVG, as well as it's volume. We believe that this extra information will help you spot reliable IFVGs easier.
⚙️SETTINGS
1. Tickers
You can set up to 5 tickers for the screener to scan Fair Value Gaps here. You can also enable / disable them and set their individual timeframes.
2. General Configuration
FVG Zone Invalidation -> Select between Wick & Close price for FVG Zone Invalidation.
IFVG Zone Invalidation -> Select between Wick & Close price for IFVG Zone Invalidation. This setting also switches the type for IFVG consumption.
Zone Filtering -> With "Average Range" selected, algorithm will find FVG zones in comparison with average range of last bars in the chart. With the "Volume Threshold" option, you may select a Volume Threshold % to spot FVGs with a larger total volume than average.
FVG Detection -> With the "Same Type" option, all 3 bars that formed the FVG should be the same type. (Bullish / Bearish). If the "All" option is selected, bar types may vary between Bullish / Bearish.
Detection Sensitivity -> You may select between Low, Normal or High FVG detection sensitivity. This will essentially determine the size of the spotted FVGs, with lower sensitivities resulting in spotting bigger FVGs, and higher sensitivities resulting in spotting all sizes of FVGs.

Simple ICT Order Blocks and Fair Value Gaps by Gowtham KannakajeThis scripts identifies ICT Order Block and ICT Fair Value Gaps
Fair Value Gap:
- Fair Value Gap toggle is off by default
- Users can choose to color the bars having Fair Value Gaps or can select to define the Fair Value Gap using boxes.
- Bar color and box colors can be customized
Order Blocks:
- Order Block box and candle color toggle is on by default
- Users can choose to color the Order Block candles or can select to define the Order Blocks using boxes.
- Bar color and box colors can be customized for bullish and bearish Order Block separately
Note:
- Order Blocks are considered valid only if the candle forming the Fair Value Gap closes away from the Order Block.
- Since Trading View limits the number of boxes to 500, it is advised to use the Color Candle option to identify the Order Blocks or Fair Value Gaps which are very old.
New concept Definitions:
Naked OB : An order block whose immediate next candle forms a Fair Value Gap. Here, the Order Block high or low contributes to the formation of Fair Value Gap.
Covered OB : An order block whose immediate next candle doesn't form a Fair Value Gap. Here, the Order Block high or low doesn't contribute to the formation of Fair Value Gap. Instead it will have other candles in between the Order Block and Fair Value Gap.
Disclaimer: The usage of this indicator might or might not contribute to your profits and losses and the author is not responsible for the same.
Happy Trading.
